The foreign exchange market, which is usually known as “forex” or “FX” is the largest financial market in the world. In this market a trader can trade in CURRENCIES PAIRS (EURUSD, GBPUSD, GBPJPY, etc..), COMMODITIES (Gold, Silver, Platinum, Energies etc..), INDICES (Dax, Dow, NASDAQ, UK100, FTSE etc..) and CRYPTOCURRENCIES independently by using of a trading account with anyone of the regulating forex broker.
| CODE | COUNTRY | CURRENCY | NICKNAME |
|---|---|---|---|
| USD | United States | Dollar | Buck |
| EUR | Eurozone | Euro | Fiber |
| JPY | Japan | Yen | Yen |
| GBP | Great Britain | Pound | Cable |
| CHF | Switzerland | Franc | Swissy |
| CAD | Canada | Dollar | Loonie |
| AUD | Australia | Dollar | Aussie |
| NZD | New Zealand | Dollar | Kiwi |
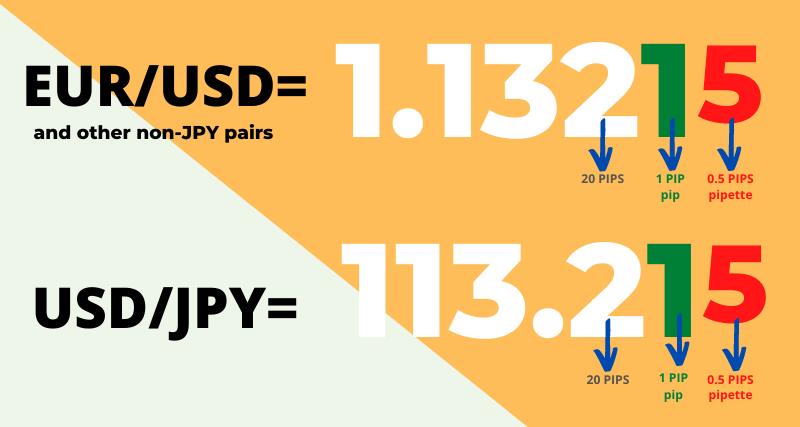
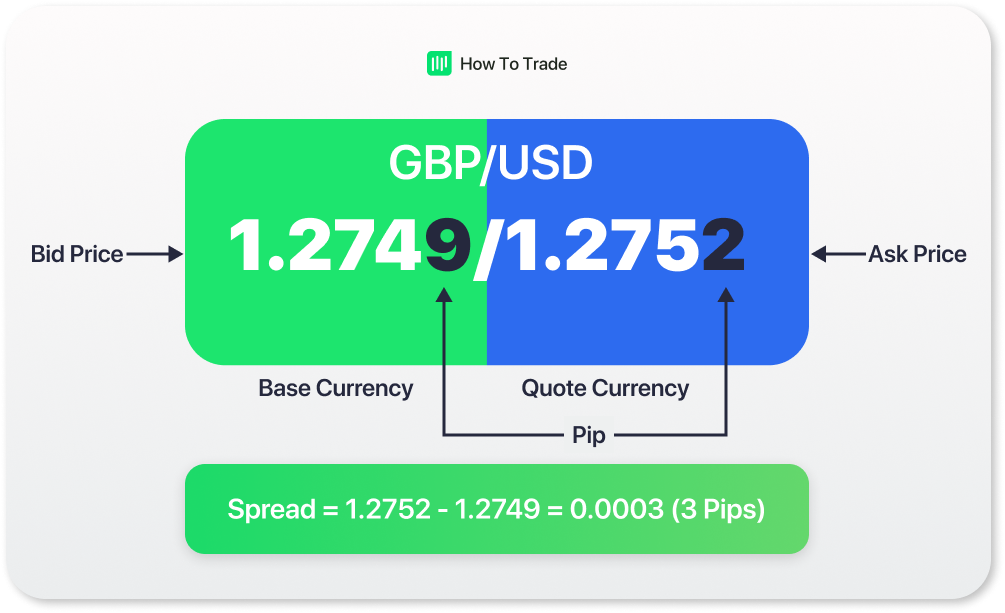
A pip is usually the last decimal place of a price quote. If GBPUSD moves from 1.1049 to 1.1050, that .0001 USD rise in value is ONE PIP. A pip is a measurement of movement in forex trading, used to define the change in value between two currencies.
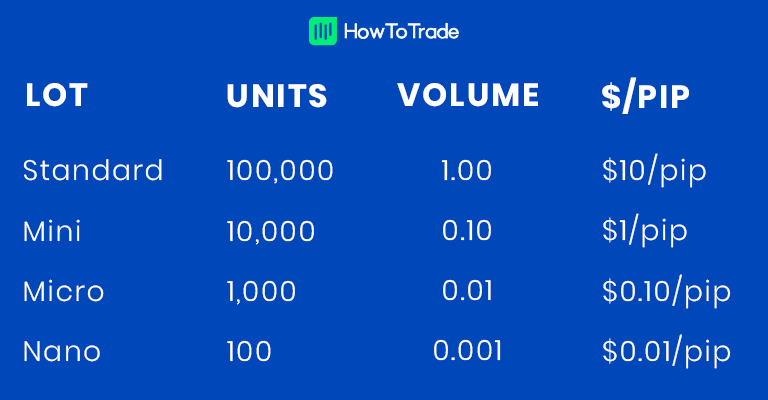
A “lot” is a unit measuring a transaction amount. Basically the number of currency units you will buy or sell.
It is true that the forex market is open 24 hours a day, but that doesn’t mean it’s always active the entire day. The forex market can be broken up into four major trading sessions:
- The Sydney session
- The Tokyo session
- The London session
- The New York session.


- Technical Analysis
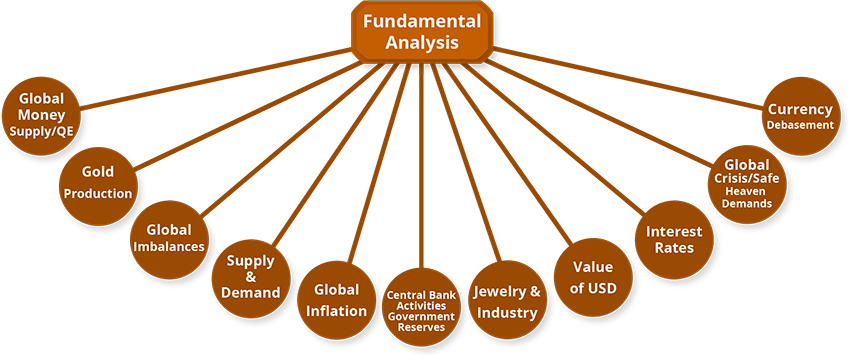
- Fundamental Analysis
- Sentiment Analysis


When the price moves up and then pulls back, the highest point reached before it pulled back is now resistance.
Resistance levels indicate where there will be a surplus of sellers.
When the price continues up again, the lowest point reached before it started back is now support.
Support levels indicate where there will be a surplus of buyers.
